Market Overview
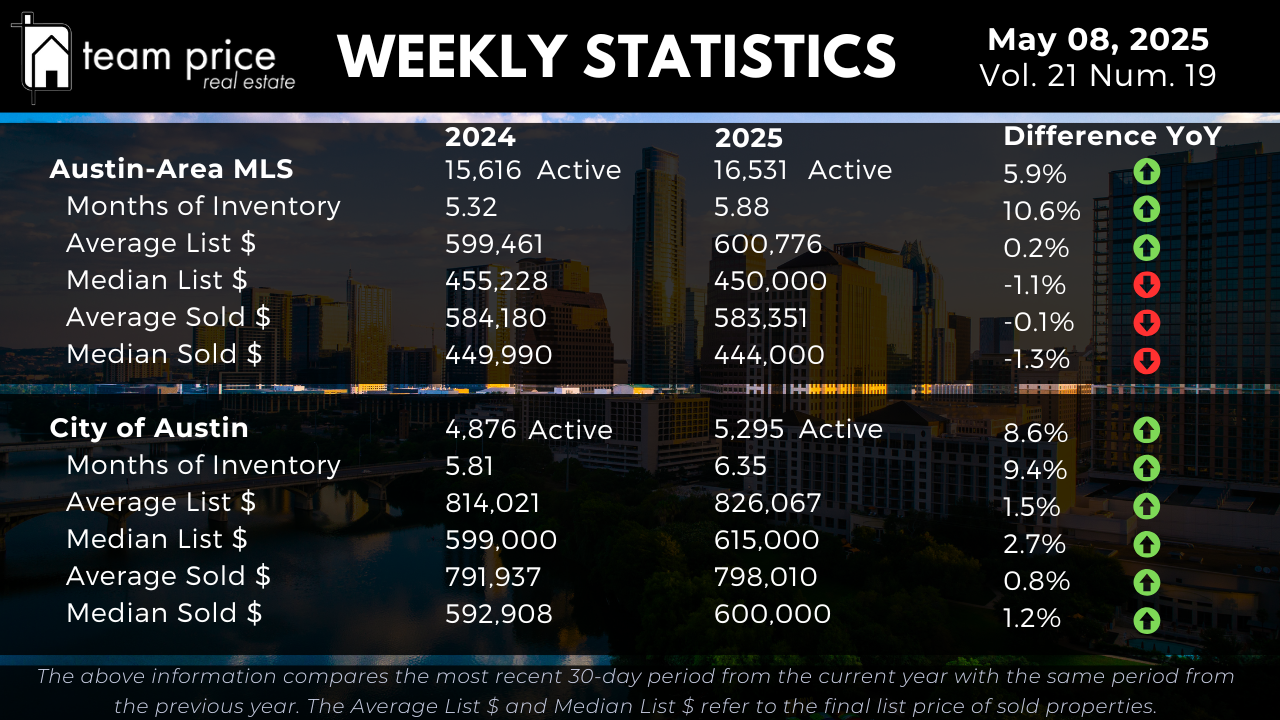
The Austin-area MLS currently lists 16,531 active properties as of April 2025, up 5.9% from 15,616 at this time last year. This growth in inventory is reflected in the Months of Inventory, which has increased 10.6% year-over-year to 5.88 months, up from 5.32 months in April 2024. This indicates a slower sales pace and a more buyer-friendly environment across the region. In the City of Austin, active listings rose 8.6% to 5,295 from 4,876, while Months of Inventory climbed 9.4% to 6.35 months from 5.81. These increases represent a 1.1x jump in both the overall Austin-Area MLS and the City of Austin, underscoring a broad shift in supply trends heading deeper into 2025.
Pricing Dynamics in Austin Real Estate
The Austin-area MLS continues to show signs of pricing stability with minor shifts. The average active list price in April 2025 rose 0.2% year-over-year to $600,776 from $599,461, while the average sold price dipped slightly by 0.1% to $583,351 from $584,180. Median values show a bit more variation: the median active list price declined 1.1% to $450,000 from $455,228, while the median sold price decreased 1.3% to $444,000 from $449,990. In the City of Austin, prices moved higher. The average active list price is now $826,067, up 1.5% from $814,021, and the median active list price climbed 2.7% to $615,000 from $599,000. On the sold side, the average price rose 0.8% to $798,010, and the median sold price increased 1.2% to $600,000 from $592,908. These figures highlight a pattern of regional flattening alongside moderate gains in the City of Austin.
City and Regional Dynamics
Across the 30 Central Texas cities monitored, market conditions remain mixed. Thirteen cities posted month-over-month price increases, representing 43% of the total, while sixteen (53%) experienced declines. The year-over-year trend is similarly split, with 13 cities (43%) showing price increases and 17 (57%) showing decreases. None of the cities are priced above their 12-month peak values—30 of 30 have seen a price decline from their respective peaks. Among the 75 zip codes tracked, 33 (44%) recorded month-over-month price increases, while 41 (55%) saw decreases. On a year-over-year basis, 28 zip codes (37%) showed price appreciation, while 47 (63%) declined. No zip codes are currently priced above their 12-month peaks, with all 75 remaining below. These patterns suggest continued market recalibration and price compression across the broader region.
Sales vs. List Price Analysis
In April 2025, 64.39% of homes sold below list price, down from 66.46% the month before. Meanwhile, 22.66% of homes sold at list price, up from 21.32% in the previous month. A total of 12.95% of properties sold above list price—an increase from 12.21% last month, but still under the 15.29% recorded in March 2024. The average sold-to-list price ratio stands at 97.80%, indicating that while some negotiation continues, sellers are achieving relatively close to their list prices.
Peak Value Analysis: Austin-Area MLS
The Austin-area MLS remains below its previous highs across all key price metrics. The average list price reached a new high of $733,290 in April 2025, but has since declined 7.9% to $674,736. The median list price has dropped 8.3% from its May 2022 peak of $539,900 to $495,000. The average sold price is down just 0.9% from $664,515 in May 2022 to $658,410, while the median sold price has declined 9.7% from $538,000 to $486,000. Average price per square foot has fallen 14.2% from $324 in April 2022 to $278, and the median price per square foot has decreased 17.1% from $280 to $232. These figures reflect a steady correction from the highs seen in 2022.
Peak Value Analysis: City of Austin
In the City of Austin, the average list price reached a peak of $975,300 in April 2025 but has since declined 11.2% to $866,386. The median list price hit $677,450 in April 2025, now down 11.6% to $599,000. The average sold price remains at its all-time high of $895,687 as of May 2025. However, the median sold price is still down 5.5% from its May 2022 peak of $680,000 to $642,500. The average price per square foot has dropped 16.3% from $442 to $370, and the median price per square foot has fallen 13.2% from $393 to $341. These trends show that while some metrics have rebounded or set new records, the overall sales market continues to operate below the highs of recent years.