

Austin Housing Market 2025: Are We Heading for a Crash?
Published | Posted by Dan Price
Is the Austin Housing Market Crashing? A Data-Driven Look at 2025
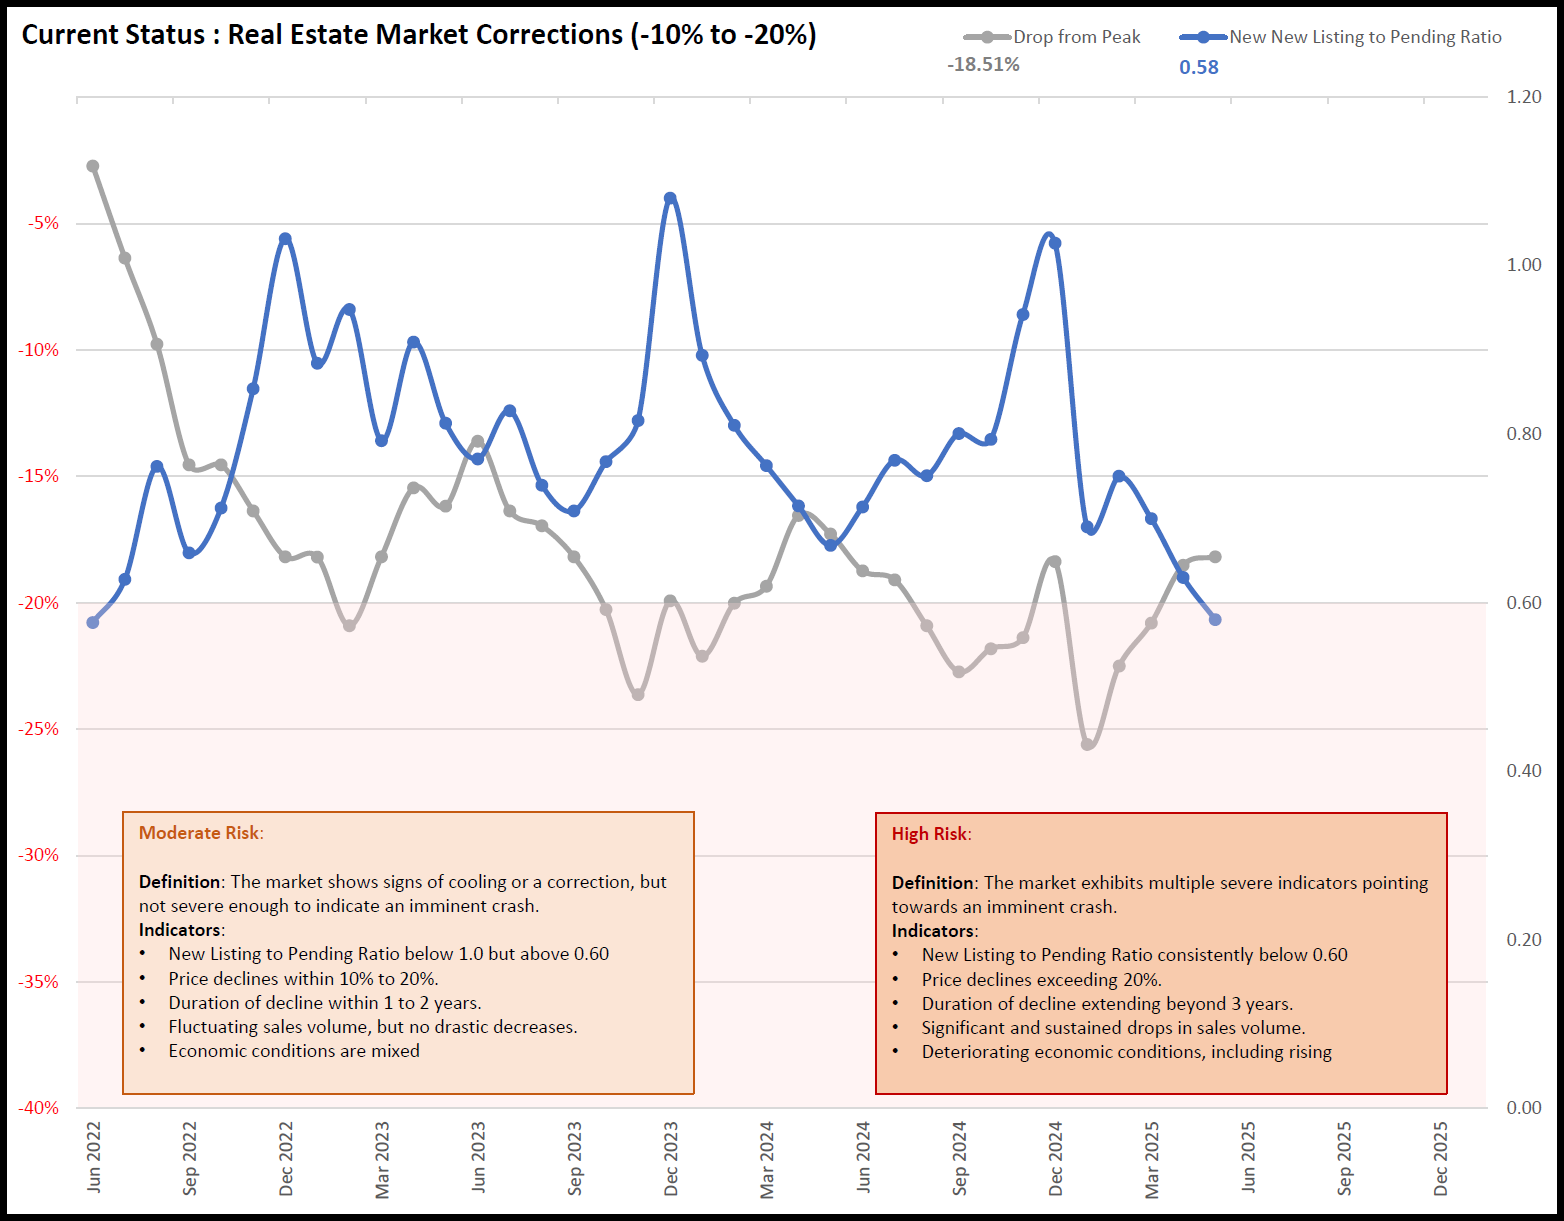
As of June 2025, the Austin housing market is exhibiting signs of a significant slowdown. While not officially in a crash, key indicators suggest the market is under considerable pressure. A comprehensive analysis of leading and lagging metrics provides insight into the current state of the market.
At Team Price Real Estate, we use a framework based on over 25 years of Austin-area market data to determine whether the market is heading toward a crash. This methodology is explained in full on our Market Cycle page, which includes historical trends, risk thresholds, and clearly defined indicators. The final two pages of that report provide the criteria we use today—tracking both the New Listing to Pending Ratio (leading indicator) and the percentage drop from the peak in Median Sold Price (lagging indicator). These metrics, when sustained for three consecutive months, give us a reliable way to classify a true market crash.
The New Listing to Pending Ratio measures how quickly the market is absorbing inventory. When this ratio falls below 0.60 for three consecutive months, it signals an imbalance—homes are entering the market faster than they are going under contract. In May 2025, this ratio dropped to 0.58, marking the first month under the warning threshold.
The Median Sold Price functions as a lagging indicator. It reflects actual transaction values and provides a clear picture of long-term market behavior. When this metric falls by 20% or more from its peak and remains there for at least three consecutive months, it confirms the market is in a crash. Currently, the Austin median sold price is down 18.51% from its peak in May 2022.
This combination of indicators allows us to distinguish between a typical correction and a full-blown crash. Corrections may see a 10%–20% drop over one to two years, with recovery typically taking two to four years. Crashes, on the other hand, often involve 20%–50% declines, longer durations, and significantly delayed recoveries—as was the case during the 2008 housing downturn.
As of today, we are not yet in a crash. But if current trends continue through the next two months—if the absorption ratio remains under 0.60 and the price decline crosses the 20% mark—then the classification will shift. This is why we track these metrics daily, weekly, and monthly. One-off months can create false signals, so sustained trends are critical in understanding real market movement.
If you’re a buyer, seller, or investor navigating the Austin-area real estate market, keeping an eye on these data points is essential. Our team remains committed to transparency and timely updates. You’ll find all the latest metrics and commentary on our daily reporting pages and at teamprice.com.
Frequently Asked Questions
1. What is the New Listing to Pending Ratio in real estate?
The New Listing to Pending Ratio measures the rate at which new inventory is being absorbed by the market. It’s calculated by dividing new and back-on-market listings by the number of active under contract and pending listings. A ratio below 0.60 for several consecutive months indicates rising inventory and declining buyer activity, which often precedes price corrections.
2. How do you define a real estate market crash?
A crash in the Austin housing market is defined by two conditions: (1) a New Listing to Pending Ratio under 0.60 for at least three consecutive months, and (2) a 20% or greater decline in the Median Sold Price from the market’s peak, also for three consecutive months. This dual-trigger approach filters out temporary anomalies and focuses on sustained market shifts.
3. What is the current market status in Austin as of June 2025?
As of June 2025, the Austin market is in a transitional state. The New Listing to Pending Ratio for May was 0.58—under the 0.60 warning level for one month. Meanwhile, the Median Sold Price is down 18.51% from its May 2022 peak. While not yet a crash, if these trends continue for two more months, the classification will change.
4. Why don’t you use list prices to measure a crash?
List prices often lag behind market reality because sellers are slow to adjust their expectations. Median sold price data reflects actual closing values, offering a more reliable measure of where the market truly stands. During corrections, list prices tend to remain inflated until price reductions or prolonged time on market force changes.
5. Where can I see the historical trends and crash thresholds you use?
Our full crash model, including definitions of pullbacks, corrections, and crashes, is available on our Market Cycle page. That page includes over 25 years of data and a breakdown of risk levels based on key indicators like absorption rate, price decline, and time on market.
Related Articles
Keep reading other bits of knowledge from our team.
Request Info
Have a question about this article or want to learn more?
